First quarter of 2021 shows positive trends, sets tone for rest of the year
First quarter of 2021 shows positive trends, sets tone for rest of the year
Multiple-listed sales recorded in 90% of City’s residential neighborhoods
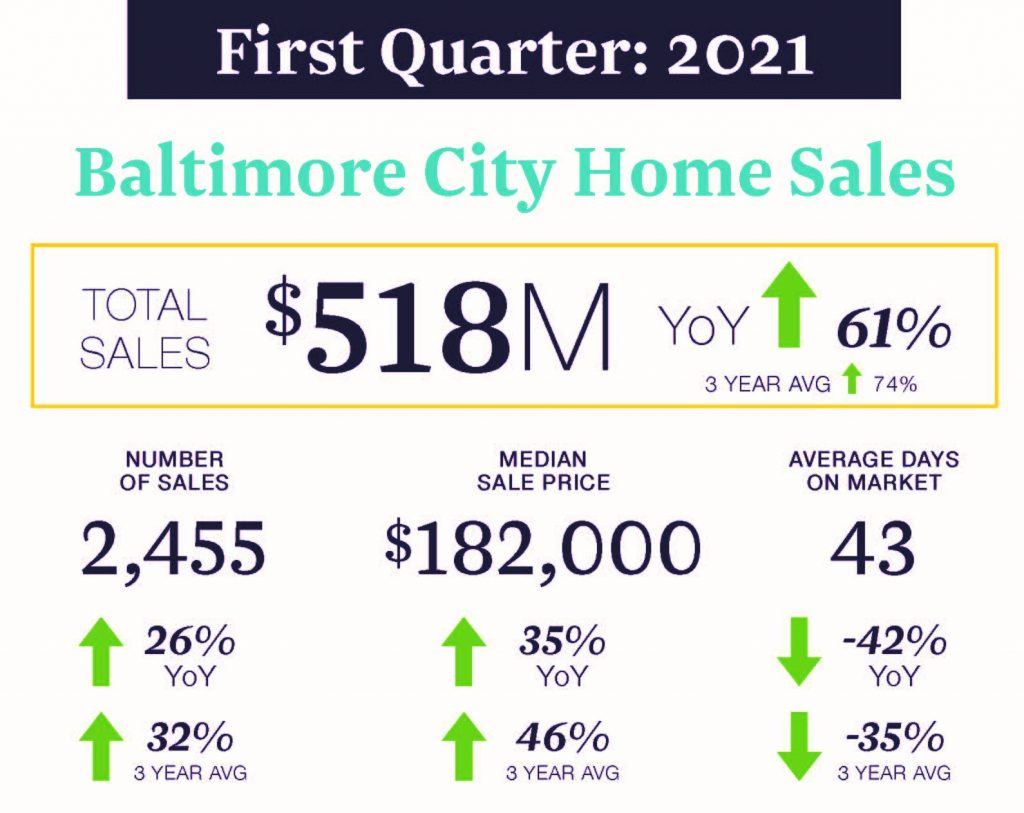
BALTIMORE, MARYLAND—With 961 transactions, March 2021 was the best-selling March since 2010—by far—topping off a positive quarter for Baltimore City’s real estate market.
Despite a notable decline of bank-owned sales, which did not take place this year but which typically make up a high number of Q1 transactions in the City, 26% more homes were purchased in Baltimore in the first quarter of 2021. The dominance of standard sales (not distressed or bank-owned) in the market is partly driving Q1’s 35% year-over-year price increase. However, prices in the luxury market rose by a still impressive 26% in the same period.
Additionally, Baltimore City homes sold 30 days faster, on average in the first quarter of 2021 versus the first quarter of 2020 with multiple-listed sales recorded in 228 Baltimore City neighborhoods. This represents more than 90% of City neighborhoods that include housing.
“The tone is set for record-breaking purchase activity in Baltimore City this year,” Live Baltimore Executive Director Annie Milli said. “With each month of the first quarter shattering decades-old records, there is no question that demand for housing is high citywide.”
Neighborhoods of Note:
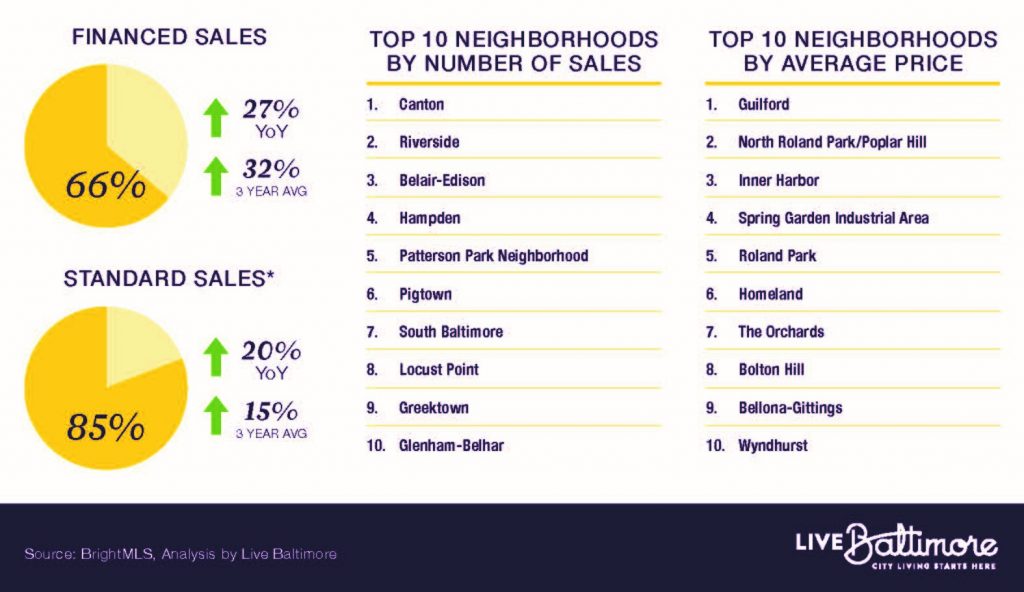
In the luxury market, Locust Point recorded the most March sales while Homeland led in sales price for the month. The market’s median was $344,500. In the competitive market, Canton recorded the most March sales. Spring Garden Industrial Area (adjacent to South Baltimore) led in sales price for the month. The market’s median was $284,650. In the upper-middle market, Greektown recorded the most March sales. Dickeyville led in sales price for the month. The market’s median was $199,900. In the lower-middle market, Belair-Edison recorded the most March sales. Dorchester led in sales price for the month. The market’s median was $127,650. In the distressed market, Millhill recorded the most March sales. East Baltimore Midway led in sales price for the month. The market’s median was $54,500.
Quick Facts:
• The median price increased 26% for the quarter, year-over-year, in the City’s luxury market.
• Baltimore City homes sold 30 days faster, on average in the first quarter of 2021 versus the first quarter of 2020.
• Home sales dollar volume nearly doubled from the first quarter of last year in both competitive and distressed markets. Total sales were up 84%, to $195 million in total sales, in the City’s competitive market. They were up 92%, to $30 million in total sales, in the distressed market.
• Multiple-listed sales were recorded in 228 City neighborhoods in Q1 of 2021. This represents more than 90% of City neighborhoods that include housing.
• 961 sales (839 standard) in March, +37% (+51% standard) from March 2020; Q1 of 2021: 2,455 total, +26%; 2,090 standard, +52% from Q1 2020
• The previous best-selling March was in 2018, when 780 sales were recorded. For reference, February 2010 included only 473 sales.
• While remaining the most affordable county in the metro region, March’s average ($210,926) and median ($189,000) sale prices are up 28% and 13%, respectively, over last year.
• Compared to last March, homes sold 42% faster—averaging 42 days. This is a slight improvement from February, when homes sold in only 45 days.
• Sales continue to be spread broadly across the city, with 196 neighborhoods represented in March transactions.
• The market improved by every measure (volume, price, speed, financing, and transaction type) in lower-middle markets compared to last March.
• The City’s competitive and upper-middle markets saw a negligible decline in their percent of financed transactions compared to last year. All other indicators showed improvement.
• The City’s distressed market continues to show a year-to-date decline in its number of transactions, due to a weak January.
• The City’s luxury market led in volume gain for the month. However, price increases continue to be most significant in lower-middle and distressed markets.
• The sale-to-list price ratio in upper-middle markets shows that homes are consistently fetching more than their asking price.
- Save your recommendations for later.
- Get access to our Financial Incentives Tool.
- Connect with a Live Baltimore staff member for a one-on-one consultation.
- Get a free I ♥ City Life bumper sticker.
- Save your recommendations for later.
- Get access to our Financial Incentives Tool.
- Connect with a Live Baltimore staff member for a one-on-one consultation.
- Get a free I ♥ City Life bumper sticker.